Sharpe ratio measures excess return per unit of risk: (R - Rf) / σ
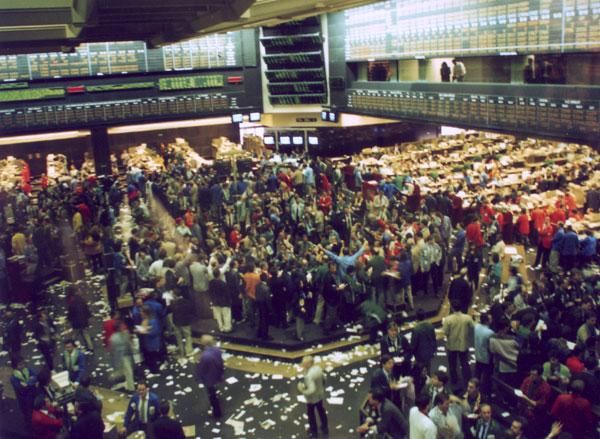
Image: Jeremy Kemp (moved from en:Image:Chicago bot.jpg on the English Wikipedia). en:Image:Chicago bot.jpg, Public domain, via Wikimedia Commons
Sharpe ratio
Sharpe ratio measures excess return per unit of risk: (R - Rf) / σ
The Sharpe ratio quantifies the excess return of an investment compared to a risk-free asset, adjusted for risk. It is a key metric in finance for evaluating investment performance.
The Sharpe ratio is calculated by taking the difference between the investment's return and the risk-free return, then dividing by the standard deviation of the investment's returns. This formula highlights the trade-off between risk and return.
Developed by William F. Sharpe in 1966, the Sharpe ratio has become a fundamental tool for investors to assess the risk-adjusted performance of their portfolios.
Example
If an investment has a return of 12%, a risk-free rate of 3%, and a standard deviation of 5%, the Sharpe ratio would be (12% - 3%) / 5% = 1.8.
Remember this
Understanding the Sharpe ratio helps investors make informed decisions by comparing the risk-adjusted returns of different investments.
Text adapted from Wikipedia, licensed under CC BY-SA 4.0.
Related concepts
Treynor ratio
Treynor ratio measures excess return per unit of systematic risk
Sortino ratio
Ever wondered how to compare investments fairly, considering their risks?
Deflated Sharpe ratio
DSR penalizes upside volatility as much as downside
Information ratio
Information ratio = Active return / Tracking error
Cronbach's alpha
Cronbach's alpha (α) measures internal consistency
Beta (finance)
Beta measures a stock's volatility relative to the market
Educational content, not financial advice.
Swipe through 100 ML concepts daily
Open Pocket Polymath