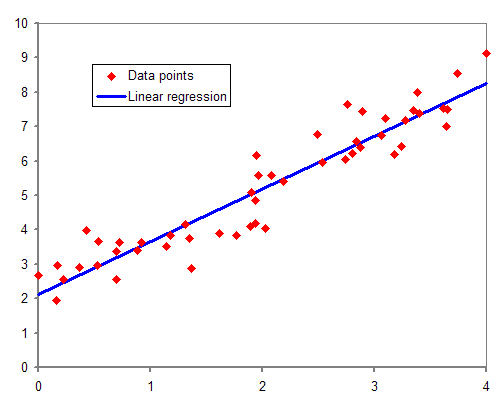
Why do straight lines sometimes fail to fit our data perfectly?
Image: Amatulic at English Wikipedia (same as Anachronist on Wikimedia), Public domain, via Wikimedia Commons
Ridge regression
Why do straight lines sometimes fail to fit our data perfectly?
Imagine trying to predict a friend's height based on their shoe size. You notice that friends with similar shoe sizes tend to have similar heights, but sometimes the predictions are off.
Ridge regression helps when shoe sizes (independent variables) are too closely related, making it hard to predict height (dependent variable) accurately. It adds a small bias to the predictions to improve accuracy.
Example
If one friend wears shoes size 8 and another friend wears shoes size 9, and both friends are 170 cm tall, Ridge regression might predict a height of 169 cm for a friend wearing shoes size 8.5, instead of 170 cm, to avoid overestimating height due to shoe size correlation.
Remember this
Ridge regression introduces a tiny bias to reduce the impact of multicollinearity, leading to more reliable predictions.
Text adapted from Wikipedia, licensed under CC BY-SA 4.0.
Related concepts
L1 vs L2 regularization: L1 gives sparsity (feature selection), L2 gives small weights
L1 regularization: L1 = L2 + sparsity; L2 regularization: L2 = L1 + small weights
Ridge regression uses L2 to shrink coefficients without eliminating them
Why do some roads get smoother and straighter over time?
Regularization (mathematics)
L1 regularization results in sparse solutions
to standardize: when you need zero mean and unit variance for gradient-based optimization
Why do we need to make data uniform before training a model?
Boosting (machine learning)
Boosting reduces bias in ML models
batch size affects generalization: larger batches find sharper minima
Larger batch sizes lead to sharper minima, enhancing generalization by providing more accurate gradient estimates
Swipe through 100 ML concepts daily
Open Pocket Polymath