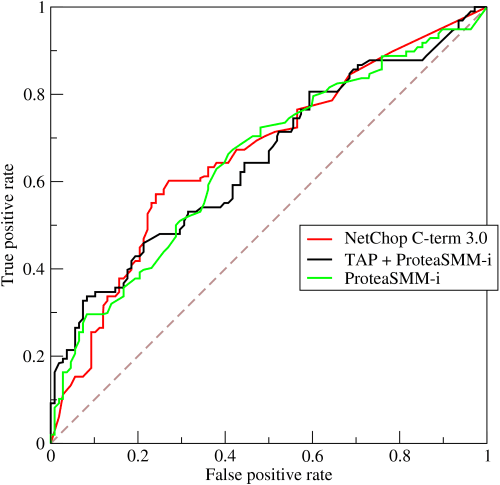
Ever wondered how doctors decide if a test really finds cancer?
Receiver operating characteristic
Ever wondered how doctors decide if a test really finds cancer?
Imagine you're at a doctor's office, and they give you a new test for cancer. You want to know if it's good at finding real cases without raising too many false alarms.
Picture a graph where the left side shows how well the test catches cancer (like spotting all the real cases), and the right side shows how many healthy people it wrongly flags as having cancer. The better the test, the higher the area above this graph.
Example
If the test catches 90% of real cancer cases but also flags 10% of healthy people, the graph's area above it shows its effectiveness.
Remember this
The Area Under the ROC Curve (AUC-ROC) measures how well a test can distinguish between real cases and false alarms.
Text adapted from Wikipedia, licensed under CC BY-SA 4.0.
Related concepts
to use AUC-ROC: comparing classifiers across all thresholds
Why can't we always trust a yes-or-no answer?
Bayesian inference
Ever wondered how doctors update diagnoses as new symptoms arise?
MAP (mean average precision) measures: area under the precision-recall curve averaged across queries
Ever wondered how search engines rank your queries?
score matching does: learns the gradient of the log-density without normalizing
Ever wonder how we can compare apples and oranges fairly in studies?
to normalize features: when features have different scales and you use distance-based methods
Why do some things need to be adjusted to compare fairly?
Graduate Aptitude Test in Engineering
GATE exam assesses engineering and science undergraduate subjects for postgraduate admissions in India
Swipe through 100 ML concepts daily
Open Pocket Polymath